Research Variables
What Are Research Variables?

Lets walk through simple tutorial on research variables...
Research variables are things that we can measure, control, or manipulate. They may differ in many respects in the role they are given in our research.
Dependent vs. Independent Variables
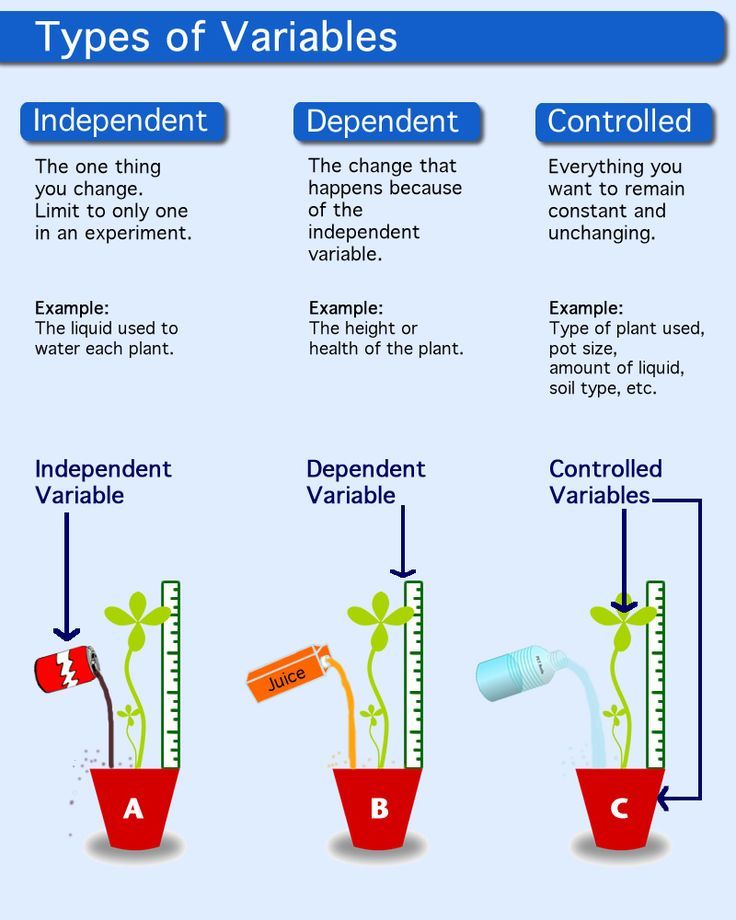
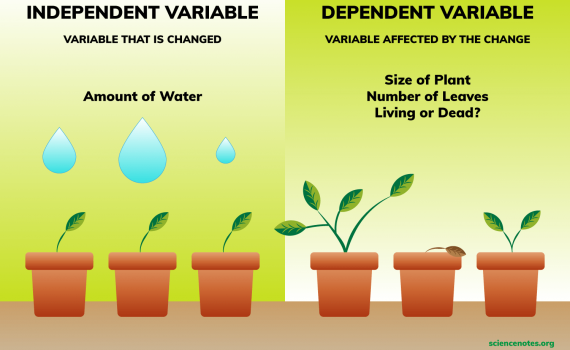
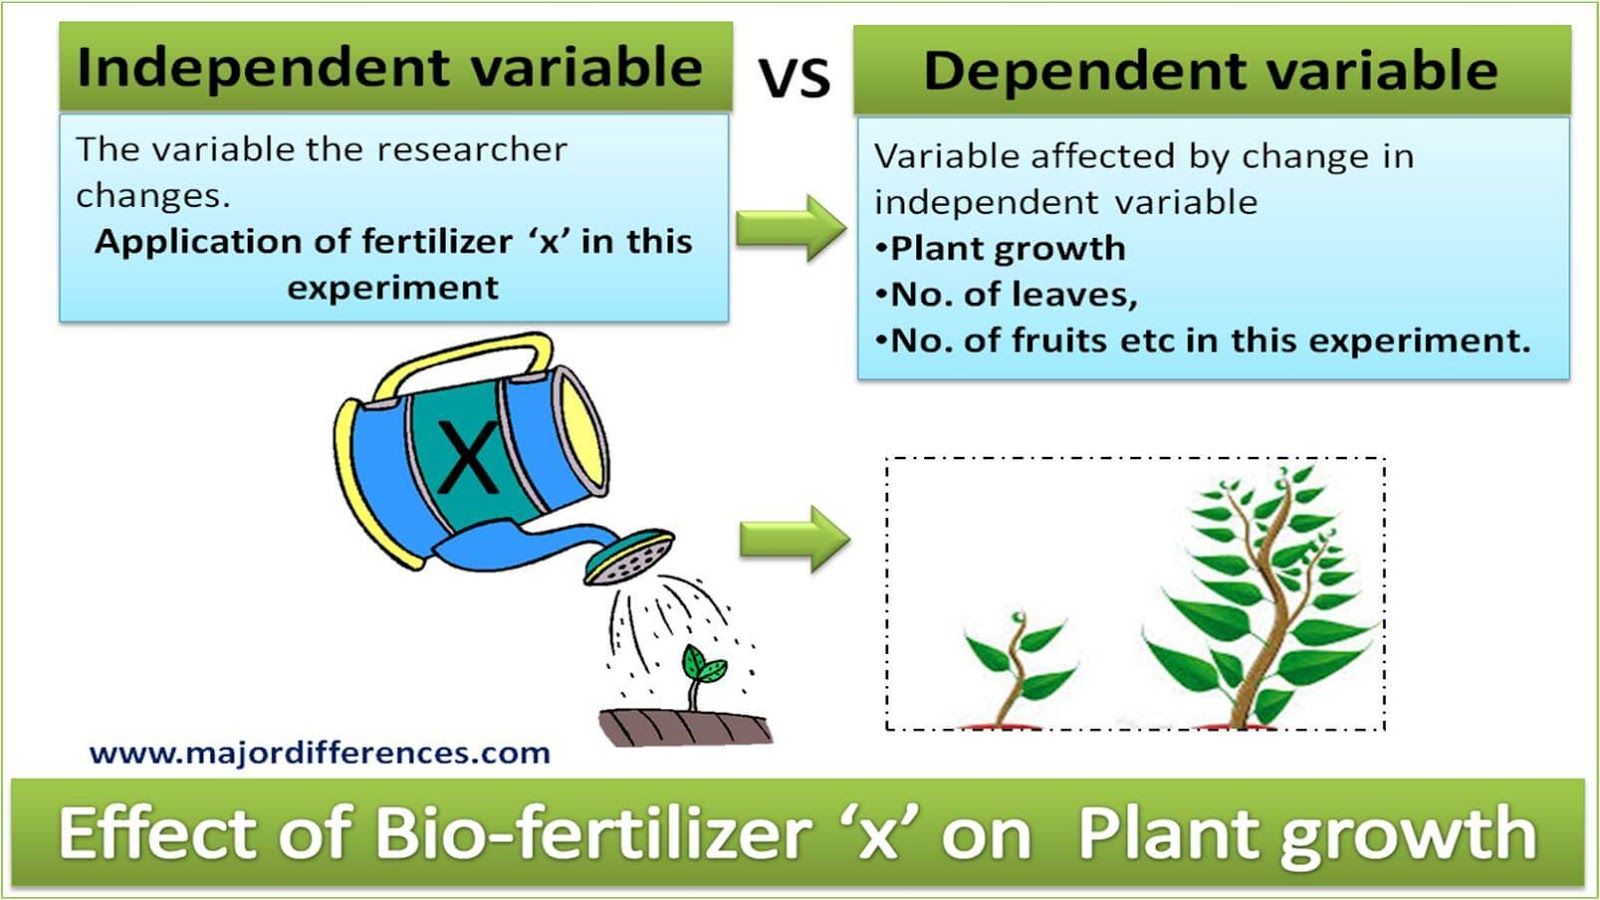
Independent variables are those that are manipulated whereas dependent variables are only measured or registered.
This distinction may appear confusing to many because, all variables depend on something. However, once you get used to this distinction, it becomes indispensable.
The terms dependent and independent variable apply mostly to experimental research where some research variables are manipulated, and in this sense they are "independent" from the initial reaction patterns, features, intentions, etc. of the subjects.
Some other research variables are expected to be "dependent" on the manipulation or experimental conditions. That is to say, they depend on "what the subject will do" in response.
Classification of Research Variables

Specifically, research variables are classified as (a) nominal, (b) ordinal, (c) interval, or (d) ratio.
Nominal variables allow for only qualitative classification. That is, they can be measured only in terms of whether the individual items belong to some distinctively different categories, but we cannot quantify or even rank order those categories.
For example, all we can say is that two individuals based on gender or race or color or city, but we cannot say which one "has more" of the quality represented by the variable
Ordinal variables allow us to rank order the items we measure in terms of which has less and which has more of the quality represented by the variable, but still they do not allow us to say "how much more."
A typical example of an ordinal variable is the socioeconomic status of families. For example, we know that upper-middle is higher than middle but we cannot say that it is, for example, 18% higher.
Interval variables allow us not only to rank order the items that are measured, but also to quantify and compare the sizes of differences between them.
For example, temperature, as measured in degrees Fahrenheit or Celsius, constitutes an interval scale. We can say that a temperature of 50 degrees is higher than a temperature of 40 degrees, and that an increase from 20 to 40 degrees is twice as much as an increase from 30 to 40 degrees.
Ratio variables are very similar to interval variables; in addition to all the properties of interval variables, they feature an identifiable absolute zero point.
They allow for statements such as x is two times more than y. Typical examples of ratio scales are measures of time or space. For example, as the Kelvin temperature scale is a ratio scale, not only can we say that a temperature of 200 degrees is higher than one of 100 degrees, we can correctly state that it is twice as high. Interval scales do not have the ratio property.
Most statistical data analysis procedures do not distinguish between the interval and ratio properties of the measurement scales. They may be used interchangeably. So just get the basic concept right.
Internal & Ratio variables are those which can be fully quantified, compared & measured in many ways & angles. Most likely you are going to use this category of variables in your Six Sigma projects.
Relations Between Research Variables

Research variables are related if their values systematically correspond to each other for these observations. For example, Gender and White Cells would be considered to be related if most males had high White cells and most females with low White cells, or vice versa; Height is related to Weight because, typically, tall individuals are heavier than short ones.
Why Relations between Research Variables are Important
Generally speaking, the ultimate goal of every research or scientific analysis is to find relations between research variables. The philosophy of science teaches us that there is no other way of representing "meaning" except in terms of relations between some quantities or qualities; either way involves relations between research variables. Thus, the advancement of science must always involve finding new relations between research variables.
Correlation research involves measuring such relations in the most straightforward manner. However, experimental research is not any different in this respect. For example, the above mentioned experiment comparing White cells in males and females can be described as looking for a correlation between two variables: Gender and White cells.
Statistics does nothing else but help us evaluate relations between variables.
Two Basic Features of Every Relation between Variables

The two most elementary formal properties of every relation between research variables are the relation's (a) magnitude (or "size") and (b) its reliability (or "truthfulness").
Magnitude (or "size"). The magnitude is much easier to understand and measure than the reliability. For example, if every male in our sample was found to have a higher White cells than any female in the sample, we could say that the magnitude of the relation between the two variables (Gender and White cells) is very high in our sample. In other words, we could predict one based on the other.
Reliability (or "truthfulness"). The reliability of a relation is a much less intuitive concept, but still extremely important. It pertains to the "representativeness" of the result found in our specific sample for the entire population.
In other words, it says how probable it is that a similar relation would be found if the experiment was replicated with other samples drawn from the same population.
Remember that we are almost never "ultimately" interested only in what is going on in our sample; we are interested in the sample only to the extent it can provide information about the full population or data.
Strength vs. Reliability of a Relation between Variables

We said before that strength and reliability are two different features of relationships between research variables. However, they are not totally independent. In general, in a sample of a particular size, the larger the magnitude of the relation between variables, the more reliable the relation.
Stronger Relations between Variables are More Significant
Assuming that there is no relation between the respective variables in the population, the most likely outcome would be also finding no relation between these variables in the research sample. Thus, the stronger the relation found in the sample, the less likely it is that there is no corresponding relation in the population.
As you see, the magnitude and significance of a relation appear to be closely related, and we could calculate the significance from the magnitude and vice-versa; however, this is true only if the sample size is kept constant, because the relation of a given strength could be either highly significant or not significant at all, depending on the sample size.
Significance of a Relation between research variables depends on the size of the sample
If there are very few observations, then there are also respectively few possible combinations of the values of the variables and, thus, the probability of obtaining by chance a combination of those values indicative of a strong relation is relatively high.
Consider the following illustration. If we are interested in two variables (Gender: male/female and White cell: high/low), and there are only four subjects in our sample (two males and two females), then the probability that we will find, purely by chance, a 100% relation between the two variables can be as high as one-eighth. Specifically, there is a one-in-eight chance that both males will have a high White cells and both females a low White cells, or vice versa.
Now consider the probability of obtaining such a perfect match by chance if our sample consisted of 100 subjects; the probability of obtaining such an outcome by chance would be practically zero.
Small Relations Can be Proven Significant Only in Large Samples

The earlier example indicate that if a relationship between research variables in question is "objectively" (i.e., in the population) small, then there is no way to identify such a relation in a study unless the research sample is correspondingly large. Even if our sample is in fact "perfectly representative," the effect will not be statistically significant if the sample is small. Analogously, if a relation in question is "objectively" very large, then it can be found to be highly significant even in a study based on a very small sample.
Consider this additional illustration. If a coin is slightly asymmetrical and, when tossed, is somewhat more likely to produce heads than tails (e.g., 60% vs. 40%), then ten tosses would not be sufficient to convince anyone that the coin is asymmetrical even if the outcome obtained (six heads and four tails) was perfectly representative of the bias of the coin.
However, is it so that 10 tosses is not enough to prove anything? No; if the effect in question were large enough, then ten tosses could be quite enough. For instance, imagine now that the coin is so asymmetrical that no matter how you toss it, the outcome will be heads. If you tossed such a coin ten times and each toss produced heads, most people would consider it sufficient evidence that something is wrong with the coin. In other words, it would be considered convincing evidence that in the theoretical population of an infinite number of tosses of this coin, there would be more heads than tails. Thus, if a relation is large, then it can be found to be significant even in a small sample
What about “No Relation" – Is it a Significant Result?
The smaller the relation between research variables, the larger the sample size that is necessary to prove it significant. For example, imagine how many tosses would be necessary to prove that a coin is asymmetrical if its bias were only .000001%! Thus, the necessary minimum sample size increases as the magnitude of the effect to be demonstrated decreases. When the magnitude of the effect approaches 0, the necessary sample size to conclusively prove it approaches infinity.
That is to say, if there is almost no relation between two research variables, then the sample size must be almost equal to the population size, which is assumed to be infinitely large.
Statistical significance represents the probability that a similar outcome would be obtained if we tested the entire population. Thus, everything that would be found after testing the entire population would be, by definition, significant at the highest possible level, and this also includes all "no relation" results.