Statistical Correlation
Relationship Between Two & More Variables

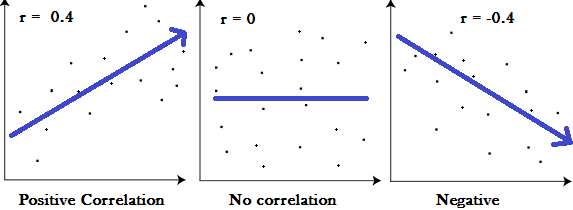
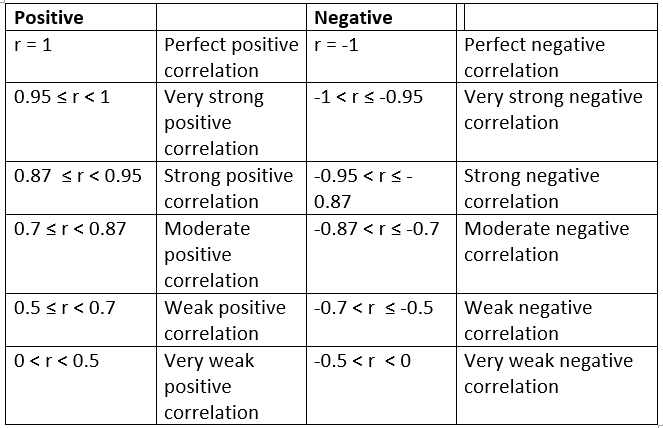
Statistical Correlation is a measure of the relation between two or more variables. The measurement scales used should be at least interval scales, but other correlation coefficients are available to handle other types of data. Correlation coefficients can range from -1.00 to +1.00. The value of -1.00 represents a perfect negative correlation while a value of +1.00 represents a perfect positive correlation. A value of 0.00 represents a lack of correlation
The most widely-used type of statistical correlation coefficient is Pearson r, also called linear or product- moment correlation.
Pearson statistical correlation assumes that the two variables are measured on at least interval scales, and it determines the extent to which values of the two variables are "proportional" to each other. The value of correlation (i.e., correlation coefficient) does not depend on the specific measurement units used; for example, the correlation between height and weight will be identical regardless of whether inches and pounds, or centimeters and kilograms are used as measurement units. Proportional means linearly related; that is, the correlation is high if it can be "summarized" by a straight line (sloped upwards or downwards).
This line is called the regression line or least squares line, because it is determined such that the sum of the squared distances of all the data points from the line is the lowest possible. Note that the concept of squared distances will have important functional consequences on how the value of the correlation coefficient reacts to various specific arrangements of data.

Interpreting the Values of Statistical Correlation
The statistical correlation coefficient (r) represents the linear relationship between two variables. If the correlation coefficient is squared, then the resulting value (r2, the coefficient of determination will represent the proportion of common variation in the two variables (i.e., the "strength" or "magnitude" of the relationship). In order to evaluate the correlation between variables, it is important to know this "magnitude" or "strength" as well as the significance of the correlation.

Significance of Statistical Correlation
The significance level calculated for each correlation is a primary source of information about the reliability of the correlation. The significance of a correlation coefficient of a particular magnitude will change depending on the size of the sample from which it was computed. The test of significance is based on the assumption that the distribution of the residual values (i.e., the deviations from the regression line) for the dependent variable y follows the normal distribution, and that the variability of the residual values is the same for all values of the independent variable x.
Outliers
Outliers are atypical (by definition), infrequent observations. Because of the way in which the regression line is determined (especially the fact that it is based on minimizing not the sum of simple distances but the sum of squares of distances of data points from the line), outliers have a profound influence on the slope of the regression line and consequently on the value of the correlation coefficient. A single outlier is capable of considerably changing the slope of the regression line and, consequently, the value of the correlation. Please note, that just one outlier can be entirely responsible for a high value of the correlation that otherwise (without the outlier) would be close to zero. Needless to say, one should never base important conclusions on the value of the correlation coefficient alone (i.e., examining the respective scatter plot is always recommended).
Please note that if the sample size is relatively small, then including or excluding specific data points that are not as clearly "outliers" as the one shown in the previous example may have a profound influence on the regression line (and the correlation coefficient).